Home Blog Page 229

Westkam Reaching its Target

Kal Kotecha PhD

When I look at prospective companies to invest in, one important trait that I seek is consistency. I look for consistent improvement in the company’s financial statements, consistent innovation or deployment of best practices, and most importantly in the junior mining sector; I look for consistency in reaching the targets the company sets for itself across functional areas. Working largely with speculative resources, junior mining companies need to implement a level of stability to their operation by setting targets and timelines and reaching them within reasonable margins of error. WestKam Gold Corp. has achieved this stability through its diverse property resources and commitment to reaching operational goals.

WestKam Gold Corp. (TSX.V – WKG) (“WestKam” or the “Company”) is a Canadian gold exploration company focused on developing the 100% owned Bonaparte Gold Project Near Kamloops, British Columbia. A veteran of the industry, the Company was incorporated in British Columbia on October 2, 1984 as Consolidated Goldwin Ventures Inc. Effectively on April 30, 2012 the Company changed its name to WestKam Gold Corp., which coincided with a significant change in management and direction. The Company’s strategy is to identify, acquire, explore and develop precious and base metal deposits amenable to low production costs and high operating margins, focusing on properties with low entry level costs. WestKam has delivered consistent progress since its managerial change, implementing a successful exploration program, a drill campaign and identifying additional resources outside of its initial discovery zone. This has been achieved while maintaining effective relations with nearby First Nations tribe Stk’emlupsemc te Secwepemc Nation.

Announced in November of 2015, WestKam intends to raise up to $1,954,000 by way of a non-brokered private placement of units (the “Offering”) and flow-through units of the Company at a price of $0.03 per unit. The proceeds of the Offering will be used to conduct a Phase II work program on the Company’s Bonaparte property, to repay outstanding debt and for working capital and general corporate purposes. Phase II expenses will primarily be directed toward an expansive underground 220m drill program on the Bonaparte property along with legal and accounting costs, marketing, rent and office costs, consulting fees and management fees.

WestKam currently boasts a share price of $0.04 – an increase on its original offering price of $0.03 per unit in November 2015. As noted by the Globe and Mail, “WestKam Gold Corp. shares have gained 60% year to date. Shares have outperformed the S&P TSX by 44.58% during the last year” (The Globe and Mail, 2016). The increase has coincided directly with gold’s stellar performance in the first quarter of 2016, which has benefited many junior mining companies. Recently gold prices have fluctuated but we expect the price to rebound and remain firm across the year, catalyzing junior mining companies such as WestKam with it. This is affirmed by Michael Armbruster, founder at Altavest who suggests “gold is likely to benefit from some key “tailwinds.” Those tailwinds include central banks moving to negative interest rates and investors looking to diversify into alternative investments due to heightened U.S political uncertainty and mixed messages from the U.S. Federal Reserve” (MarketWatch, 2016). As has been the trend historically, stalwart gold succeeds during times of uncertainty, and the currency, market and political fluctuations all point to smooth sailing for investors of gold and its compliments.

WestKam Gold Corp. – 3 Month Share Performance

westkamgold

(The Globe and Mail, 2016) Consistent growth in share price across 2016

The Company has a history of marketing success both in its mining yields and in properties themselves. The last bulk sample that WestKam sold fetched nearly $150,000 for 161.950 Troy Ounces. Even more impressive, several members of WestKam’s management, including President & CEO Matt Wayrynen, team have had significant success in past mining ventures. As Director of his last venture, Quinto Mining, Mr. Wayrynen helped raise millions of dollars and advanced a Quebec iron ore property to a viable project. Quinto Mining sold to Consolidated Thompson Iron Mines in June 2008 for a share value equal to $175 Million. Later, Consolidated Thompson was sold to Cliffs Resources for nearly $5 Billion, thanks in large part to the efforts Wayrynen forwarded to advance the Quebec property. These marketing successes align directly with the theme of consistency that has pushed WestKam and its Bonaparte Property forward in recent years, and without doubt, history is the best predictor of future behavior.

The Bonaparte Property consists of diverse resources across its area, which are defined as the “Discovery Zone” and “Cooler Creek Zone”. Within the Discovery Zone, which is the area that has been primarily explored since 1984, a 3,425-ton bulk sample from one of the high grade vein systems produced a grade of 26 g/t Gold (0.75 oz/ton Gold). Within the Cooler Creek Zone, which is the area drilled and tested in 2015, a new vein assayed 7.88 g/t Gold (0.253 oz/t Gold), 38.4 g/t Silver, 0.33% Copper and 28.6 g/t Tellurium over 1.0 meters. The diversity in resources of the still relatively unexplored property posits a major advantage for the Company and its investors in that it can look to extract and sell these individual resources, or the property at large to a major mining company, based on timely conditions presented by the market.

bonaparte-property
Map of WestKam’s Bonaparte Property

Looking at the map above, it is important to note the additional mining entities in the region. Specifically, New Gold Inc. operates its New Afton Project, an open-pit gold and silver mine, within an hour of the Bonaparte Property. New Gold Inc. is working toward its growth strategy by achieving “[E]xternal growth through additional value enhancing merger and acquisition opportunities” (New Gold, 2016). The logistical and resource advantages that the Bonaparte Property can deliver to New Gold Inc. indicates potential for a merger or acquisition to occur. Due to the average grade at the New Afton Mine, Weskam’s high grade gold deposit would be a great fit helping to enhance New Afton’s average grade. This would significantly enhance WestKam’s share price – a clear win for all stakeholders involved.

WestKam’s enduring consistency in reaching targets and timelines since 2014 gives me confidence in their capacity to continue to reach their goals and produce positive results for shareholders, capitalizing on the bull gold market we are experiencing. Beginning in 2014, WestKam implemented a series of programs designed to exploit the full potential of its Bonaparte Gold Project. These programs are highlighted as follows:

2014 Exploration at Bonaparte

• The 2014 exploration program was completed in November 2014, advancing both of the property’s key targets:
o Shear-hosted, high-grade gold mineralization in quartz veins (Discovery Zone), and
o Bulk tonnage, porphyry copper-gold target
• The 2014 field program included mapping and prospecting, 3D IP and magnetic geophysical surveys and soil geochemistry
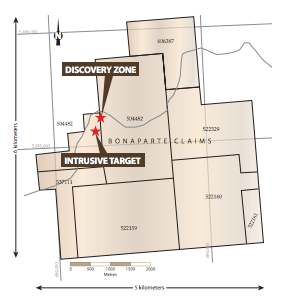
• The Voltera 3D IP and ground magnetic surveys produced information that substantially extended the strike length of the high-grade Discovery gold zone trend and a multi-phase intrusive

thediscovery
The Discovery Zone and intrusive target occupy a small
portion of the large Bonaparte Claim block

2015 Drill Campaign at Bonaparte

• The 2015 drill exploration program was completed in October 2015, representing an important follow-up to the results achieved in 2014
• Key objectives of the program included:
o Evaluate high-grade gold intercepts in the “Discovery Zone” along the Grey-Jay vein system at depth and along strike
o Evaluate historical and anomalous Cu-Au soil geochemical results overlying IP chargeability and resistivity anomalies

2015 Drill Campaign Achievement

• Upon testing, the drill exploration program identified a large new target area called the Cooler Creek Zone
• Drilling encountered veins in granodiorite with the same type of mineralization as the Discovery Zone
• The hole assayed 7.88 g/t Gold, (0.253 oz/t Gold), 28.4 g/t Silver, 0.33% Copper and 28.6 g/t Tellurium over 1.0 metres

WestKam Gold Corp. is prepared to act on the results of its 2015 Drill Campaign by conducting Phase II of its work program which, as highlighted earlier, will consist primarily of drilling in 2016. The Company is operating in a favourable market for gold with fluctuating political and currency conditions and gold prices not seen since in 30 years. This suggests that there is potential for a major mining company to purchase the property to fully extract its resources and capitalize on gold’s pricing boom.

For investors looking to diversify their portfolio by adding a junior mining company that will achieve stock success as a complement to gold over the year, the enduringly consistent WestKam Gold Corp. (TSX.V – WKG) is worth a serious look.

Works Cited

“New Gold Inc. – Company Information.” New Gold Inc. Web. 05 Apr. 2016.

“The Globe and Mail – Stock Quote.” The Globe and Mail. Web. 04 Apr. 2016.

SAEFONG, Myra. “Gold Scores Biggest Quarterly Gain in Nearly 30 Years.” MarketWatch. Web. 04 Apr. 2016

MGX Contractor Completes Capex Report for Lithum Carbonate Plant

2016-05-09 09:58 ET – News Release

Mr. Jared Lazerson reports

MGX MINERALS RECEIVES INITIAL CAPEX REPORT FOR LITHIUM CARBONATE PLANT

MGX Minerals Inc. has received the initial capital expenditure (capex) report for a lithium carbonate production plant from engineering consultant Cementation AG. The capex budget is the second part of the previously received initial process design and scoping study (see press release dated April 14, 2016).

MGX engaged Cementation AG to analyze extraction of minerals from the heavily mineralized brine within the Fox Creek and Swan Hills areas, which are part of the company’s portfolio of Alberta lithium properties. Cementation AG formulated a detailed initial capex budget based on quotations from potential vendors in addition to applying in-house expertise and experience. The capex plan provides a positive basis for the company to proceed with engineering of an initial 20,000 bpd (barrels per day) lithium carbonate production plant.

Scoping study highlights

Further details of the proposed process and production plant design are provided as follows:

  • Reduction of production time of lithium carbonate by greater than 99 per cent over current traditional brine production — one day versus 18 months;
  • Multiple end market products including lithium carbonate, sodium chloride and calcium chloride with potential for addition of boron and bromine production;
  • Strategic sourcing of reagents and energy to reduce input costs;
  • Application of energy-efficient technology to significantly reduce potential operating expenditures (opex);
  • Utilization of existing oil and gas infrastructure and expertise to reduce capex and opex.

The study includes flowsheet recommendations and operational expenditure (opex) calculations to process lithium-bearing brine of 20,000 bpd (barrels per day) in a commercial plant. The process is designed to rapidly separate brine minerals to produce various industrial mineral compounds. The study also includes a metallurgy testing protocol. MGX is currently evaluating metallurgical laboratories for bench testing of the proposed process. As a result of the positive capex report, Cementation AG has provided a six-month engineering and development project plan to follow metallurgy testing for the detailed engineering of the proposed lithium carbonate plant.

Alberta lithium properties

MGX has staked or entered into purchase agreements to acquire a 100-per-cent undivided interest in 24 metallic and industrial mineral permits throughout the province of Alberta encompassing over 1,150 square miles (300,000 hectares). These permits were acquired based on compilation of historic exploration for lithium by the province as well as oil and gas well data and known geology. The permits are all geological associated with current and past-producing oil fields.

Qualified person

This press release was prepared under the supervision and review of Andris Kikauka, PGeo, and vice-president of exploration for MGX Minerals. Mr. Kikauka is a non-independent qualified person within the meaning of National Instrument 43-101 standards.

We seek Safe Harbor.

© 2016 Canjex Publishing Ltd. All rights reserved.

Cardiff expects increased oil shows at Clayton No. 1H


2016-04-27 10:08 ET – News Release

Mr. Jack Bal reports

Cardiff Energy Corp. is providing an update on the status of the Clayton No. 1H well following successful acid treatment. As previously announced on March 30, 2016, the Clayton No. 1H was treated with 19,000 gallons of acid in nine intervals which encountered the highest hydrocarbon shows during drilling.

The reservoir responded extremely well to the treatment; strong pressure was encountered in the well with numerous gas kicks and fluids flowing to surface. The next step was to install a pump to begin pumping off the completion and drilling fluid. The completion team estimates that roughly 3,000 barrels of fluid needs to be removed from the Clayton No. 1H before significant oil cuts will be encountered. To date, over 1,000 barrels have been removed, and, during the next 10 days, the completion team expects to see increased oil shows and to be in a position to prepare the well for commercial production. Once production stabilizes, the company will be in a position to report a flow rate.

To learn more about the company and the drilling of the Clayton No. 1H horizontal well, please visit the company’s website.

The company holds a 70-per-cent working interest in the Clayton No. 1H, and its joint venture partner, Equitorial Exploration Corp., can earn up to 30-per-cent working interest. The company holds a 100-per-cent working interest in Bearcat No. 4.

We seek Safe Harbor.

© 2016 Canjex Publishing Ltd. All rights reserved.

American Lithium Appoints Squires to Board of Directors


2016-05-11 09:40 ET – News Release

Mr. Michael Kobler reports

American Lithium Corp. has appointed Andrew Squires to its board of directors. Mr. Squires brings over three decades of resource development experience in the energy and natural resources industries, both domestically and internationally. In this time, he has established a proven history of success in creating strong management teams and helping to grow new resource ventures into prosperous operations. His entrepreneurial spirit combined with his all-encompassing technical, operational and financial knowledge on the logistics and complexity in this sector are the talents that have led to his success in helping to create and monetize value in the resource development sector.

Of recent note, Mr. Squires was part of the original executive team of Osum Oil Sands Corp., a successful junior oil sands company, in which he was instrumental in creating the team and helping to raise over $1-billion in private equity, taking the company to commercial production. Prior to starting Osum Oil Sands, Mr. Squires worked for his own consulting firm, providing services for clients including Exxon, Pemex, PetroCanada and Chevron. Mr. Squires’s engineering and management skills were honed working for companies such as Dominion Exploration, Paramount Resources and Amoco.

Mr. Squires is currently an executive adviser for Osum Oil Sands, president of AXS Industries — a global energy investment advisory firm, a senior associate of Renown AMG (upstream energy asset management company), and is actively engaged in a number of start-ups and financings in the energy storage, oilfield equipment and aerospace fields. Mr. Squires holds a BSc in mechanical engineering from the University of Alberta.

Michael Kobler, Chief executive officer of American Lithium, commented: “I’ve known Andrew for over 10 years. He was the boilerplate behind the Osum Oil Sands team where we successfully built a company from inception to over a $2-billion-producing commercial entity. I am confident that Andrew will provide many important contributions towards the execution of American Lithium’s corporate strategy.”

Mr. Squires fills the vacancy created by Richard Ko, who has resigned from the board of directors. Mr. Ko will remain with the company as Chief financial officer.

© 2016 Canjex Publishing Ltd. All rights reserved.

The Lies You Are Told About Gold

0

For the last 5 years, most were caught on the wrong side of the gold market.  As gold was topping in 2011, most market participants, and analysts alike, were caught looking the wrong way.  Most were uber-bullish when the market was topping, and remained so almost the entire way down.

Why did so many get it wrong in 2011?  Why did most get it wrong for the last 4 years? Because most market participants and analysts do not understand gold.  Feel free to read that again: most market participants and analysts do not understand gold.  And, worse yet, most have bought into or sell you on the lies and fallacies about gold and are not burdened by the true facts presented through our recent history.

You Are Being Sold Lies

Just recently, I read the following in an article on Gold-Eagle.com:

Gold is the final safe haven left to securely invest in which has stood the test of time over thousands of years. It has maintained its’ value throughout at least the last five thousand years. The sudden and most recent ‘break out’ in gold is proof that its’ safe-haven status is still intact. The price of gold is rising more on the expectation of the next financial crisis.  Imagine how high the price of gold could go when the real crisis impacts world economies.” (See the following link for complete article:  http://www.gold-eagle.com/article/price-gold-going-ballistic )

I want you to consider a couple of questions about this paragraph before we prove the faulty nature of such thinking.  First, is gold really a “safe haven” from a financial crisis?  If you are willing to remove your “gold-bug” blinders, you will soon see the answer is “no.” Second, how can anyone believe that the recent break out in gold is “proof of its safe haven status” when the equity markets have rallied alongside it?  It’s a safe haven from what – a market rally?  Do equity markets also rise on the “expectation of the next financial crisis?” Lastly, the final sentence of the above-quoted paragraph is nothing more than an emotionally charged play upon your fears, as well as your greed.

At the end of the day, this is nothing more than the same type of “gold-bug” thinking that got most of you in trouble in 2011.  Have you not learned your lesson yet?  If you believe in such erroneous thinking, then you should never see gold rally alongside the equity markets and it should absolutely never fall in price when we experience a financial crisis. But, is that true about gold?

No.  These are some of the fallacies presented in order to either sell you “analysis,” or to sell you gold.  It preys upon your fears and is not based in fact.  Do you want to make an investment decision based upon your fears or based upon the truth?

These fear mongers will not point out to you that, since early February, the metals and the miners have been rallying WITH the equity markets.  They will not mention this to you since it presents a fact in opposition to their underlying erroneous thesis.  Moreover, this is not the first time that we have seen gold rally along with the equity markets, nor will it be the last.  I believe this seeming “correlation” will eventually be recognized within our markets, and it can last for several years as we have seen in past history.  But, that is simply not what you are told will happen by most of those telling you to buy goldBased upon their faulty thinking, the market is about to crash, and gold is about to skyrocket.  Yet, history disagrees with their premise.

What Does History Teach Us?

Allow me to show you why only expecting an inverse correlation between equities and metals is just outright wrong.  Of course, we can always point to the fact that metals and equity markets have been rallying together, with over double-digit returns, for the last several months.  But, let’s put that aside for now.

The main premise of these fear mongers is that gold will certainly protect you during a major market crash.  So, let’s take a look at the 2007-2009 timeframe, which evidenced the most significant period of market volatility since the Great Depression, to see if the metals acted as a “safe haven” during the period of time a safe haven was most needed in modern times.

We all know that the S&P 500 topped in October of 2007 and began an estimated 300-point decline into March of 2008. Then we saw a corrective bounce in the equities for a couple of months before it continued to head down. During that same period of time, even while the markets were heading lower, the metals continued to rally strongly. Here we have “evidence” of precious metals rising during a period of market volatility. So, maybe they are a safe haven.

But, when we then look towards the May 2008-March 2009 decline in the equity market, not only did the metals not rally, but they experienced significant declines within that time frame. In fact, gold lost a little more than 30% during the massive equity market sell off. Yes, you heard me right.  Gold and the equity markets both experienced significant declines TOGETHER.

So, here we are presented with clear evidence that gold did not act like a supposed “safe haven.” Moreover, it failed as a “safe haven” during the worst financial crisis since the Great Depression, which was the most crucial time period that a safe haven was most needed.

When one is presented with these facts, can one truly have confidence in gold’s “safe haven” status, especially when it failed during the most critical time period since the Great Depression?  Should one rely upon an analyst or salesman who is selling you on the merits of gold’s “safe haven” status in light of the true, hard lessons of recent history?  As George Santayana said, “those that cannot remember the past are condemned to repeat it.”

If you need further evidence, consider this additional fact.  Back in 2008, the folks at Elliott Wave International published a study that showed that in 10 out of 11 recessionary periods since 1945 gold experienced a negative total return.  Maybe you should be rethinking what you have been sold about gold’s “safe haven” status?

On the opposite side of the market, if one simply looks back to the period of time from 2003-2007, we will clearly see that the metals market rallied along with the equity markets for those years.  So, is it really true that the only time gold will rally is when the equity markets are in decline?

Are you starting to question the perspectives you have been “sold” about gold?  If not, then you should.

Time To Consider The Truth

When one is presented with these facts, can you really believe that metals are the “safe haven” everyone claims they are during down markets?   Can one also come to the conclusion that gold and equities markets trade inversely to each other and the reason you should be investing in gold is its “safe haven” status from a financial crisis?  Clearly, the answer is “no,” if you are truly honest in your analysis.

Again, when one actually looks at the facts rather than the supposition, fallacy, and fear being sold by most of the article writers and sellers of gold out there, it tells you to ignore much of what is presented about this market and begin to think for yourself. Much of what you have been fed about this market is simply wrong, and until you are able to look objectively at the market, you will likely see long periods of time where you are on the wrong side of the market purely because you bought into these suppositions, fallacies, and fear.  Or, did you already forget the pain you felt during the decline between 2011-2015?

Why can’t we also believe in gold as a solid investment during periods of time when financial markets rally, as history clearly shows it can be?  One simply needs to develop an appropriate understanding as to when gold will rally along with the equity market or inversely to it.

Sadly, most analysts and investors do not truly understand the gold market, and just regurgitate the same fallacies over and over to prey upon your fears and greed.  Isn’t it about time you look for an objective perspective on gold which understands how the market truly works?

Avi Gilburt is a widely followed Elliott Wave technical analyst and author of ElliottWaveTrader.net (www.elliottwavetrader.net), a live Trading Room featuring his intraday market analysis (including emini S&P500, metals, oil, USD & VXX), interactive member-analyst forum, and detailed library of Elliott Wave education. Visit his website:https://www.elliottwavetrader.net. You can contact Avi at: info@elliottwavetrader.net.

Metals Complex Pushes Us To The Limit

0

Avi Gilburt
ElliottWaveTrader.net
First published Sat May 7 for members of ElliottWaveTrader.net
For those that understand how metals trade, it is quite clear that they move to extremes. And, the main reason this is so is due to the driver of the metals market being emotionally based. Yes, you heard me right. The driver is not market crashes, or world-wide debt, or inflation, as so many have tried to sell you upon. Rather, emotion is what drives this market, and when you can understand how to track such emotion, you can have a better handle on how it may move. This is the main reason why it often pushes us to the edge of our expectations, and is driven to extreme movements.

This past week, I noted how we were going to begin the week at an extreme, and the complex was on the precipice of either a break down or break out. Our primary expectation was that it was going to break down into a corrective phase, and, thus far, the market has followed through.

But, we are not out of the woods just yet. It is still “possible” that the markets may continue to break out, so let’s go through what we need to look for in the coming week.

Again, the GDX presents us with the cleanest picture of the market, so I will begin there. As noted last weekend, it would take a strong move through the 28 region to signal we are heading to the 40+ region sooner rather than later. But, the GDX turned down right at the top of the market pivot on our daily chart, and seems have begun a corrective retracement. What supports this perspective is that the rally off the low struck on Wednesday this past week began in corrective fashion, was followed by what seems to be a triangle consolidation, with an impulsive (c) wave rally continuing thereafter, all of which I am counting as a b-wave rally.

My preference is to see the GDX maintain below the 25.80 region in the upcoming week, and then drop down below 23, which I will count as the (a) wave in the blue wave ii.

As you can see, the alternative count would suggest that we are already in wave 2 of wave iii, but I will need to see confirmation of that perspective before being able to adopt it. If GDX would be able to strongly exceed the 25.80 region, and then rally through the 26.60 level, that would be an initial indication that this “correction” has completed, and we will be watching the all-important 28 region for cues as to whether we are heading directly to the 40+ region. Again, this is not my primary expectation, but I do have to respect the manner in which the metals move, having much experience in this arena.

As far as GLD, that too seems to be completing its b-wave rally, which may have one more push higher in the coming week before it “should” turn down. As noted last weekend, resistance is between 125-126, with only a strong break out through the 129/30 region suggesting the correction is over and another major leg up is in progress.

Lastly, with regard to silver, I am still in between several potential counts, as you can see from the chart, and which has been outlined over the last several weeks. The 16.90-17.10 region remains support and upside is still open as long as we do not break that support. Should that support break, then we are either in a i-ii, 1-2 structure (blue count), or the outside chance remains for a lower low (red count). And, as I noted before, should we see a break of support, I will discuss the other counts more extensively in a mid-week update.

See charts illustrating the wave counts on the GDX, GLD and YI.

May 11, 2016
Avi Gilburt
website: ElliottWaveTrader.net

Avi Gilburt is a widely followed Elliott Wave technical analyst and author ofElliottWaveTrader.net, a live Trading Room featuring his intraday market analysis (including emini S&P 500, metals, oil, USD & VXX), interactive member-analyst forum, and detailed library of Elliott Wave education.